Automate the HR and recruitment statistics now! Hurma System will help you analyze information and much more.
Personal presentation and access to the service
We have collected all the necessary functionality in one system so that you can devote more time to the main thing - people
Automated data collection
All statistics in one section
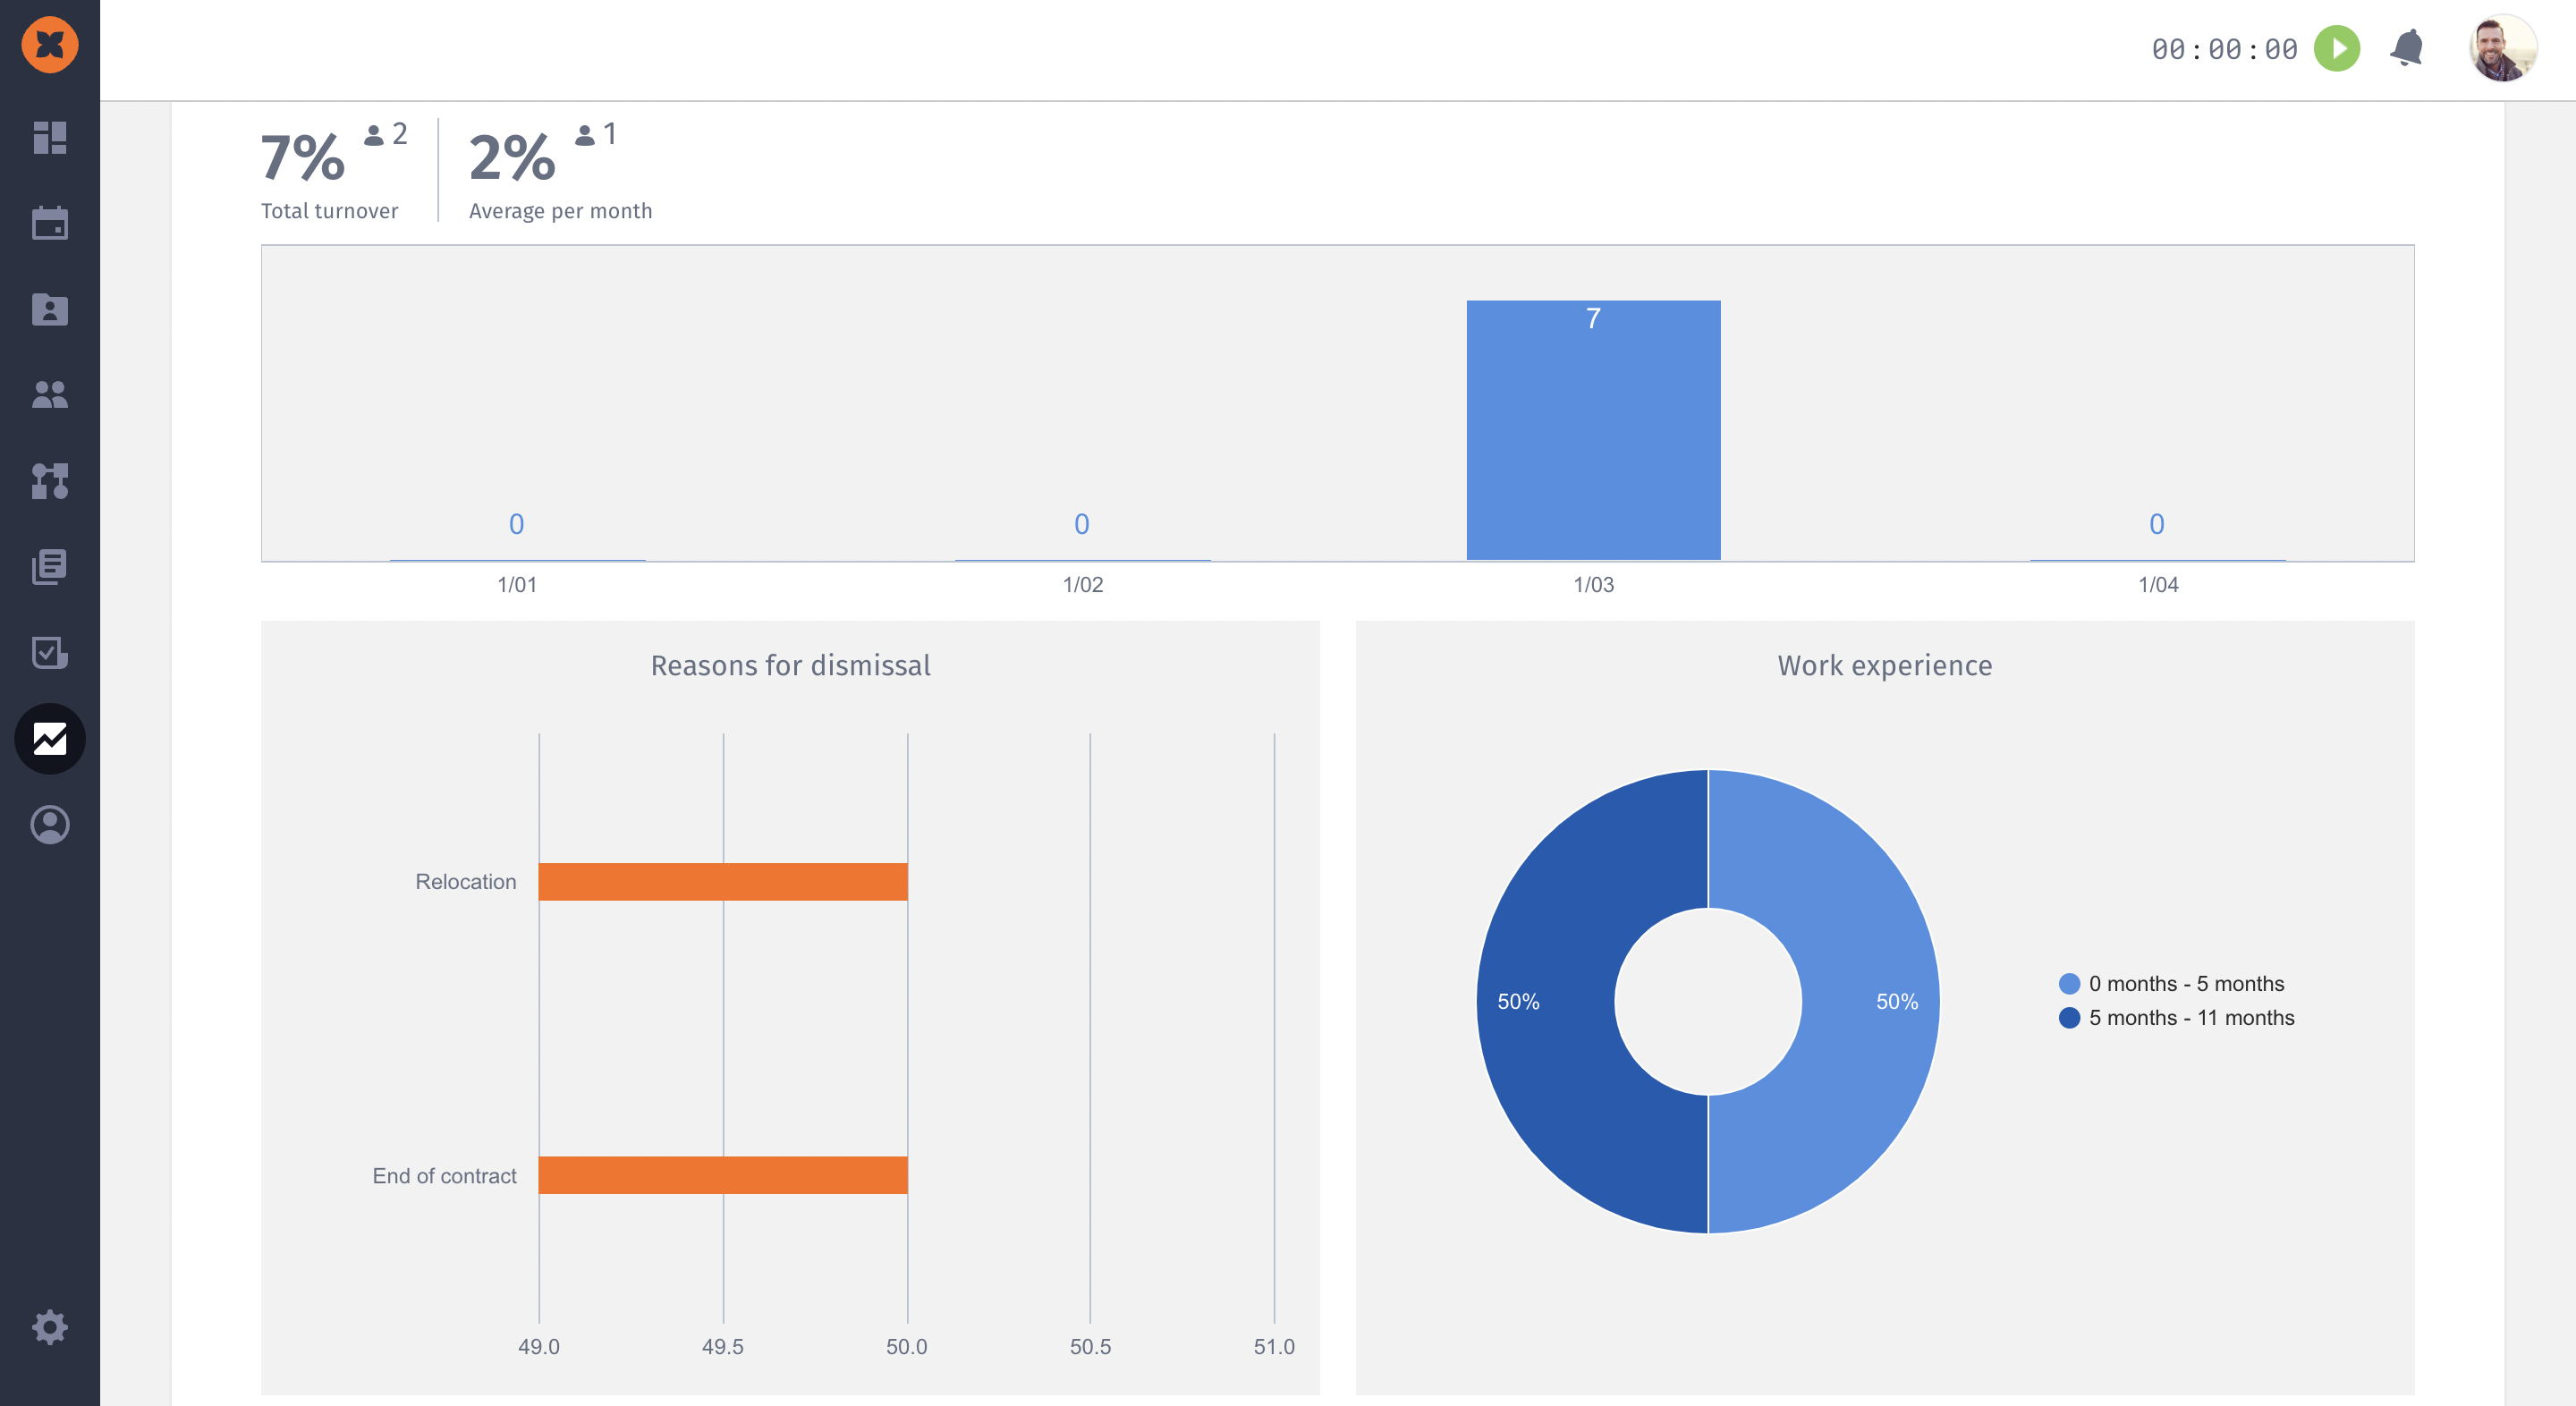
Visual graphs and charts
Mood statistics with comments
Detailed recruitment graphs
Statistics for different periods

expert in HURMA implementation and process automation
In this section, you can find information about the number of in-house employees and employees on a trial period, and you will be able to evaluate how it changed over a certain period. Statistics are available for the week, month, quarter, six months and year. It helps you to evaluate staff turnover in as many details as possible.
So you can understand the reasons, notice the increased staff turnover in time and prevent losing valuable employees. The same is about the trial period. If employees leave immediately after the trial period or right during it, statistics allows you to discover it in time and react appropriately. For example, change the adaptation methods for newcomers.
Perhaps the statistics on recruiting is even more important than HR, because you can appoint the 1:1 meeting or make eNPS survey for employees and find out the weaknesses of the company. While the situation with the candidates is much more complicated because you can’t get direct feedback.
That’s why we automated recruitment statistics in the following ways:
Thus, you can comprehensively evaluate the efficiency of processes in the recruiting department. Here you can immediately see the number of open vacancies, understand what recruitment channels perform better for your company and which ones are not worth investing in, which recruiter closes vacancies better and how many offers candidates accept.
Mood monitoring is a gamification element, that allows both to understand the general mood in the company and respond in time to different situations. For example, an employee can quickly report that he needs a lamp to work, and you will see this information and can quickly respond. As a result, the employee will feel the care of the company, and you will receive a satisfied and loyal colleague.
Keeping statistics is one of the important aspects of the work of an HR specialist. The more data you have, the more complete the statistics and the more convenient it is to analyze what’s happening in the company.
The main problem with statistics is the difficulty with collecting data from various sources. The more spreadsheets and applications you have, the more difficult it is to upload information from everywhere and collect it into one statistic.
That’s why automation allows both keeping all employees in one system and collecting statistics there. Hurma System is an all-in-one solution that automates the entire routine of an HR manager, freeing up to 50% of the working time.
When a person responds to a vacancy, he/she is automatically added to the candidate database in the system. After going through all stages of the recruitment, you transfer him/her to the employee database with one click. All these actions are recorded in the system and included to the statistical data.
Thus, you don’t need to worry about collecting statistics at all, because everything is automated. You just need to direct a candidate through all recruitment stages and don’t forget to put down actions and events for the employee. The mood monitoring works automatically too – you preset the polling frequency and when employees log into the system, a welcome screen asks them about their mood. Hurma collects data into convenient statistics and then you can work with it.
We tried to organize all the processes in the system as conveniently as possible so you only need to open the statistics section and analyze the data.
The monitoring of the current company state is very important for HR. He/she needs to have to be able to compare current results with past and predict what will happen next. That’s why Hurma collects maximum data for you to analyze.